by Diego Lucero

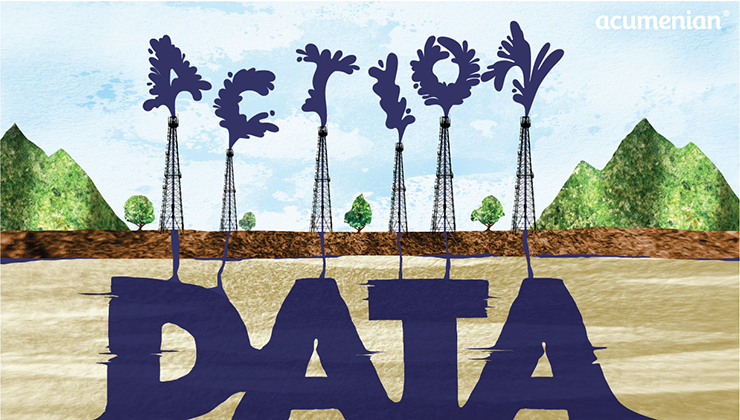
We all know that data is everywhere, and you may even have heard it is the new oil. But just like oil, if unrefined, there is not much you can do with it. One must convert the raw substance to plastic or gas to create value. This same principle applies to data, as one must break it down and analyze it to create value.

What is data analytics?

Analytics is the process of drilling into raw data and drawing insights and conclusions from it. Data analytics techniques can reveal new metrics and trends that would otherwise get lost in the mass of information.

Analytics Changes the Game

Every business, be it small or big, generates data. This data can be from logistics, marketing research, project management, customer feedback, and so on. You can collect that data, but it will only be helpful with the correct analysis tools and methods. Even if you observe unusual patterns within your data, you might need more insight to make valid conclusions. 
With data analysis, you can evaluate your data before making actionable plans. Leaders can use the outcome of analytics to improve and optimize processes and increase the efficiency of operations in a business. You may obtain strategic visibility from obscured datasets and discover what’s not evident with analytic methods. 
Companies that see the benefits of data analytics and data management are becoming more effective. Analyzing and working with data leads to better decision-making, which leads to more efficient business operations and, ultimately, better business overall.

 Key Performance Indicators

Key Performance Indicators (KPIs) are critical indicators of progress toward an intended result. KPIs provide the focus to improve operations in a timely and strategic manner, creating an analysis platform to make decisions focused on what matters most to you.

Mining and Cleaning Data

Analytics professionals perform data mining to extract usable data from a large dataset. It involves data collection, warehousing, and computer processing. They must clean data when collected to work with it, so data cleansing is crucial before you begin analyzing your data.

Data Visualization and Business Intelligence

Data visualization presents a clear picture of what the data is telling us. Data visualization makes the data easier for those making business decisions to comprehend using visuals such as bar graphs or tables. Business intelligence (BI) is the end game. It leverages analytics tools to convert data to actionable insights. Often paired with data visualization techniques, BI provides decision-makers with detailed intel about the state of the business. There are multiple BI tools to help with this process, and some of them are quite well-known in the field, such as Power BI, SAP, or Tableau.

In a world increasingly becoming reliant on information and collecting statistics, analytics helps individuals and organizations make use of their data. Using various tools and techniques, expert analysts can transform a set of raw numbers into informative insights that drive decision-making and thoughtful management. If your business is not making good use of data, chances are your rivals already are, leaving you at a severe competitive disadvantage.

Acumenian’s analysts are professionals who will take the time to investigate and help you define numerous measures, such as how to improve project workflows or where to reduce operational costs. We can help you throughout the process, from identifying new KPIs to finally using that data to tell the story that will facilitate decision-making for your business.

Related Post

Follow Us

Email: info@acumenian.com
Phones:
Florida, US: (954) 469-4444

Puerto Rico, US: 787-474-0300